Anti-Pattern: Chart Junk - Virtual Pizza Pie Chart - High Tech Chartjunk
Another anti-pattern we should consider relates to how we use visualizations or present charts.
Edward Tufte calls the clutter that often obscures charts or visualizations chartjunk.
Usually it's meaningless colors or styles that hinder rather than help clarify the actual meaning of the chart. But what happens when chartjunk meets high-tech? It gets even more useless. During the CNN coverage for the Iowa Caucus, Anderson Cooper introduced "The Magic Pie Chart". This has got to be one of the silliest abuses of technology I have seen in a long, long time. I can't wait to see what the networks come up with for the 2008 General Election.
What I love is how the technology completely takes over. It pops out and looks like it could hurt someone. Then it obscures the rest of the panelists. And finally Anderson is so enamored with trying to keep it from bursting again that he is using all his brain cycles to keep the 3D virtual pie chart on that silly piece of cardboard.
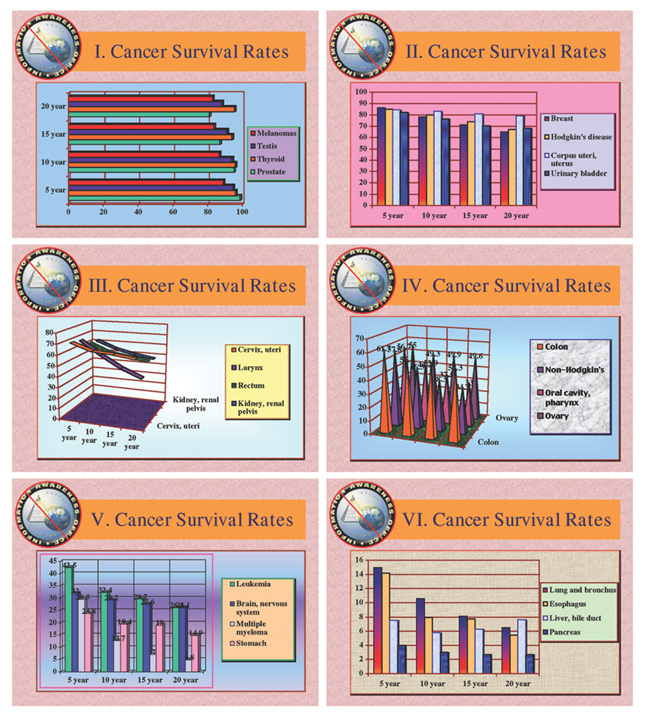
Here is a more traditional example of chartjunk from Tufte's site.